Session recordings
Follow individual visits step by step — the pages each visitor saw, how long they stayed, how far they scrolled, and where they clicked or converted.
Session Flows rebuild each visit to your site as a step-by-step journey: the pages a visitor saw in order, how long they spent on each, how far down they scrolled, and the clicks, form interactions and conversions along the way. Instead of a video, you get a clean, readable timeline of what happened — useful for understanding the path people take and where they drop off.
Note: This is a reconstructed journey, not a screen recording. nua doesn't capture video of your visitors — it pieces each session together from the activity its tracking collects.
Open Session Flows
- Open your project and go to the Analytics tab in the left sidebar.
- Near the top of the analytics, click the Session Flows button.
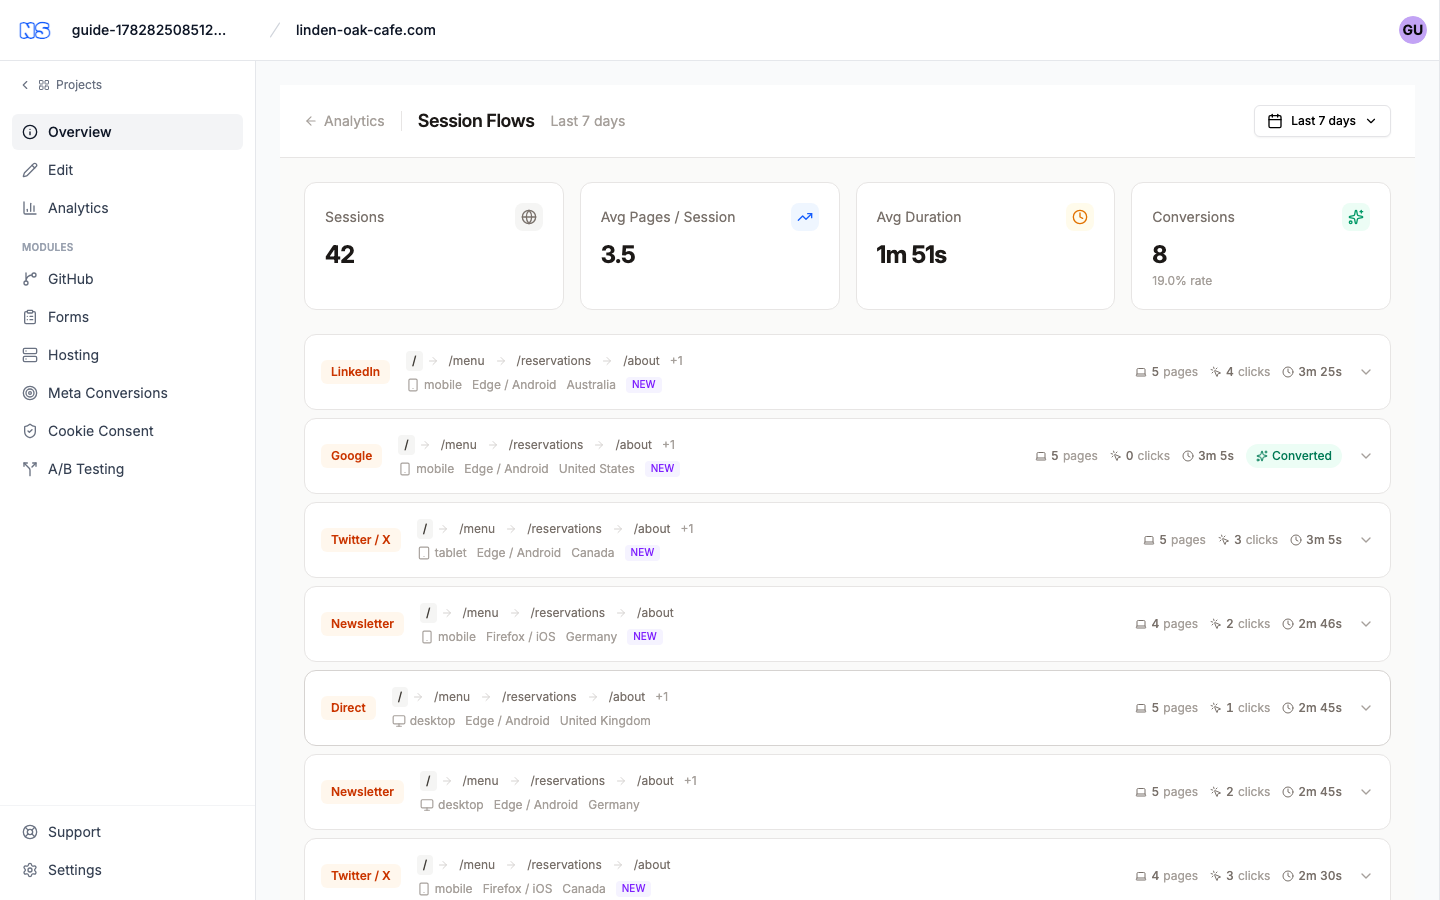
At the top of the Session Flows page you'll find an Analytics link (to go back), the Session Flows heading, and a time period selector on the right.
Choose what you're looking at
Use the period selector to switch between live and historical data:
- Realtime shows a Live badge and covers sessions from the last 24 hours, updating as people visit.
- Any other period (Today, Yesterday, Last 7 days, Last 30 days, This month, Last month, or a custom range) shows past sessions for that window, with the period named next to the heading.
Note: Historical session flows are aggregated once a day, at 7 AM UTC. If you've just turned on tracking or are looking at a recent day, the flows may not have been compiled yet — check back later. (Realtime is always up to the minute.)
Read the summary
When there are sessions in the chosen period, four cards summarize them:
| Card | What it means |
|---|---|
| Sessions | How many visits are included |
| Avg Pages / Session | Average number of pages seen per visit |
| Avg Duration | Average length of a visit |
| Conversions | How many visits converted, with the conversion rate as a percentage |
Read a single session
Below the summary, each visit is its own card. Without opening it, a card already tells you a lot:
- A source pill — where the visitor came from (for example google, facebook, direct, referral).
- A preview of the path — the first few page addresses they visited, joined by arrows. If the visit had more pages, a +N shows how many more.
- The device (a phone, tablet or desktop icon with the type), the browser / operating system, and the country when known.
- A NEW badge if this was the visitor's first session.
- Quick metrics: number of pages, number of clicks, and the duration.
- A green Converted badge if the visit reached a conversion.
Open the full journey
Click a session card to expand it. You'll see Page Journey, with a count of pages and events, laid out as a numbered timeline:
- Each step is one page, in the order it was visited. The first step is highlighted, and steps are connected top to bottom so you can follow the route.
- Each page row shows its address, the time spent on it, and a scroll bar showing how far down the page the visitor read. The bar turns green for deep scrolls, amber for partial, and stays neutral for shallow ones, with the exact percentage beside it.
- Under each page, individual events are listed — a click, a form interaction, or a conversion — each with its name and how long into the visit it happened.
If a journey is long, only the first several pages show at first; click Show N more pages to reveal the rest.
When there's nothing to show
If no visits match, you'll see No session flows found. In Realtime this means no one has visited in the last 24 hours; for a past period it usually means the daily aggregation hasn't run yet, or there simply wasn't any traffic in that window.
Where to go next
- The overall numbers behind these visits live in your project Analytics.
- To test two versions of your site against each other, see A/B testing.